CATAWBA COMMUTER SHED
INDUSTRY INVENTORY AND ANALYSIS OF TRADED CLUSTERS

Labor Force (10/2022)
1,104,167
The Catawba Commuter Shed

Unemployment Rate (10/2022)
3.72%
The Catawba Commuter Shed

Employment Number (10/2022)
1,063,144
The Catawba Commuter Shed

Net Job Creation Over 10 Years
240,421 Jobs
The Catawba Commuter Shed
TOP CLUSTERS
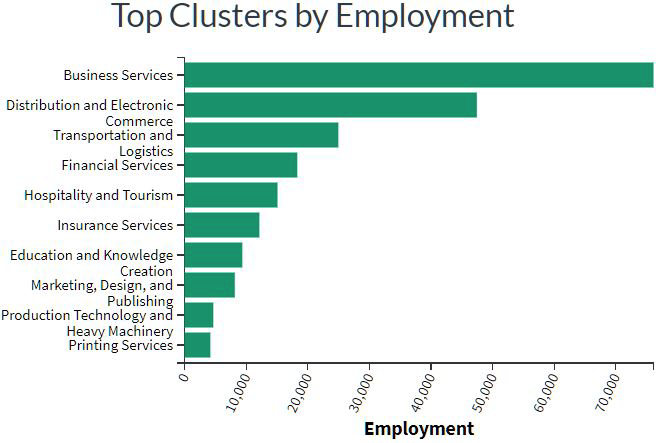
The Traded Clusters within the Catawba Commuter Shed with the highest 2019 employment numbers in excess of 25,000 were Business Services, Distribution and Electronic Commerce, and Transportation and Logistics.
Within all three of these clusters, significant growth can be seen between 2010 and 2019.


JOB CREATION
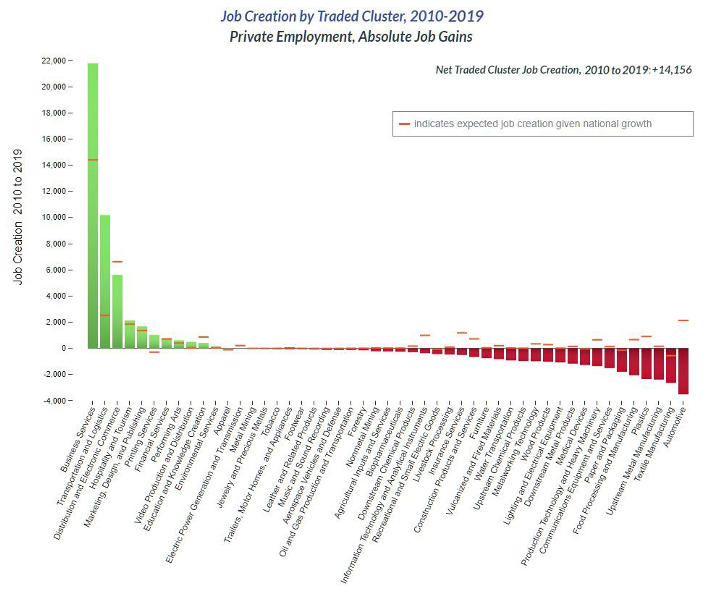
Business Services, which includes headquarters, engineering, and business support services, created 21,790 jobs during the seven year period, Transportation and Logistics added 10,190 jobs, and Distribution and Electronic Commerce added 5,618. Areas of loss during this time include Automotive, Textile Manufacturing, Upstream Metal Manufacturing, and Plastics. It should be noted, however, that losses were offset by a net creation of 14,156 jobs.
EMPLOYMENT
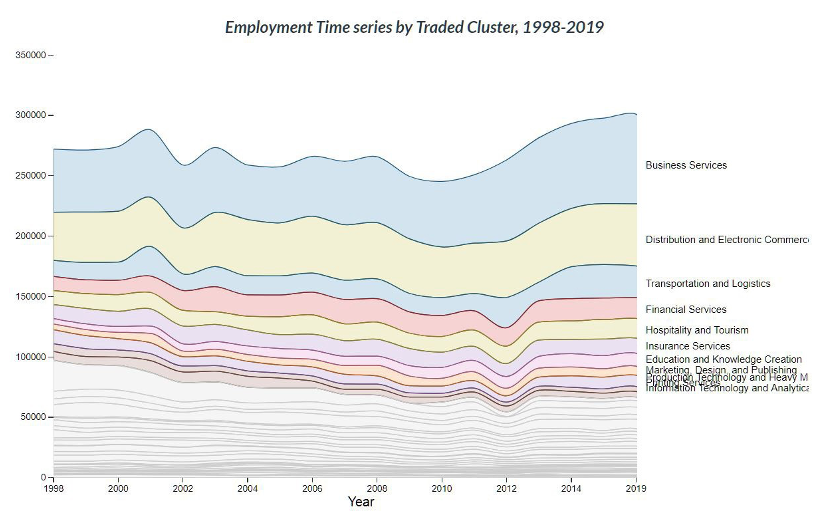
Between 1998 and 2019, employment within several of the major Traded Clusters within the commuter shed tracked with overall employment trends during this same period showing a decline between 2008 and 2009 at the apex of the great recession and a slow recovery or flat growth between 2009 and 2016.
As underscored in the prior job creation section, clusters that recovered more rapidly and / or have seen significant growth since 2011 include Business Services, Distribution and Electronic Commerce, and Transportation and Logistics.

Total employment among all traded clusters within the commuter shed have returned to levels seen in year 2000 of approximately 275,000 jobs primarily led by growth in the previously mentioned clusters.


