SUMMARY BACKGROUND
OVERVIEW
The Catawba Region’s Comprehensive Economic Development Strategy includes a wide range of demographic and socio-economic data paired with detailed analysis of the impact of the data presented; additionally the geographic scope of analysis includes counties outside the Catawba Region.
For a data-rich overview of the Catawba Region, visit the interactive data center.

REGIONS ANALYZED
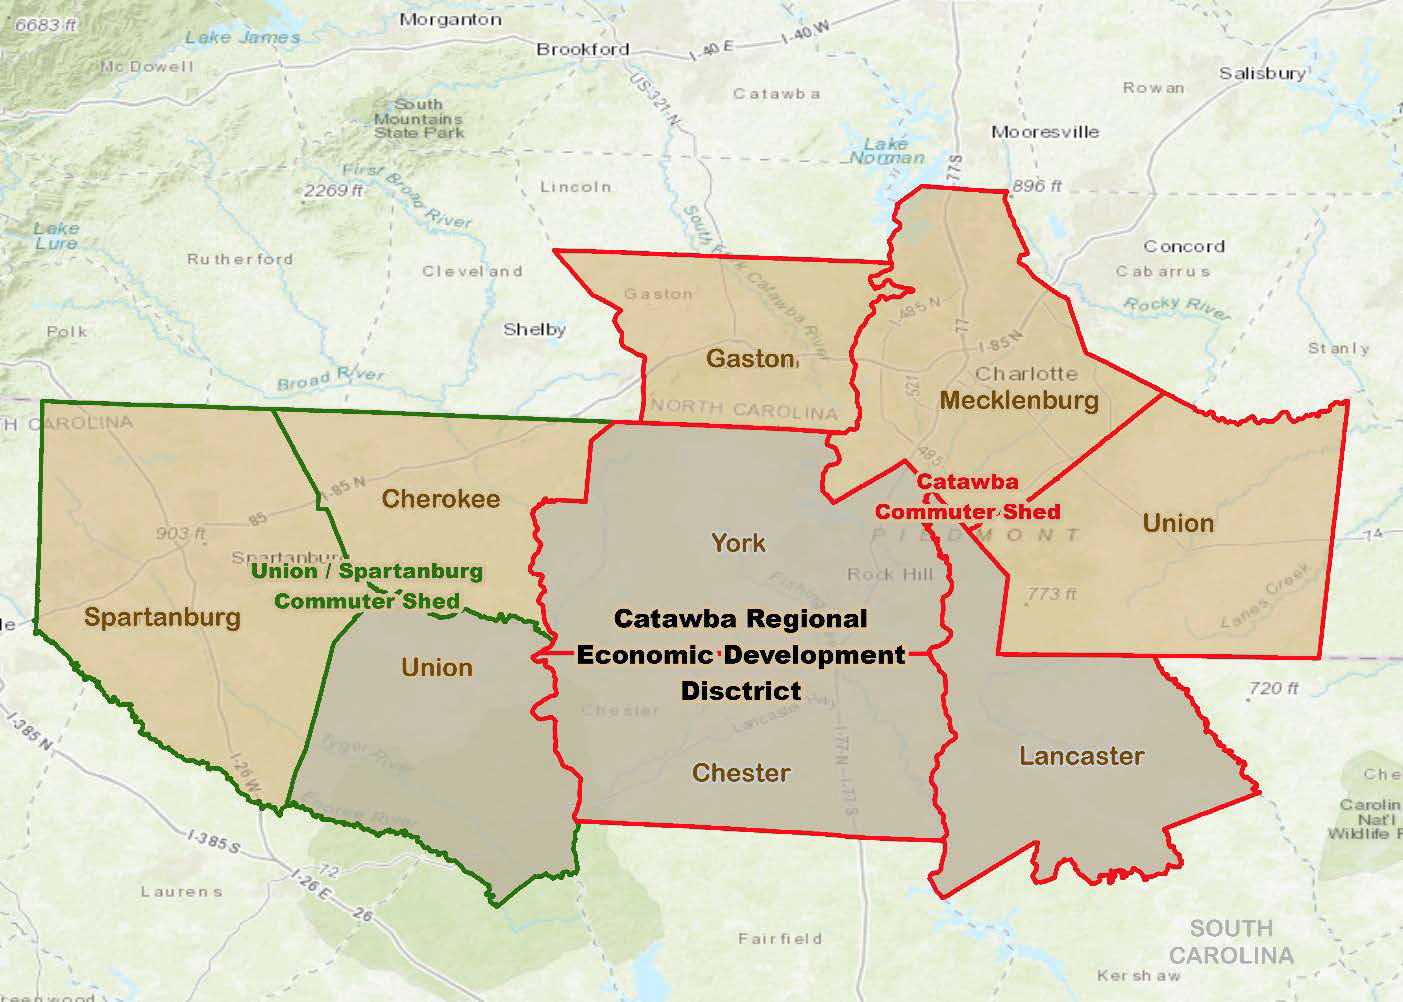
With an understanding that the economy of the Catawba Region District’s four counties of Chester, Lancaster, Union and York is influenced by surrounding counties’ economies, two additional regions and data sets are included in the scope of analysis:
- Catawba Region Commuter Shed – includes 3 of the South Carolina counties within the Catawba Region and the North Carolina counties of Gaston, Mecklenburg, and Union;
- Union / Spartanburg Commuter Shed – includes the South Carolina counties of Union, Cherokee, and Spartanburg.
PARTNERS
In development of the Comprehensive Economic Development Strategy, Catawba Regional leveraged its ties to its four member counties, their economic development offices, as well as the numerous public and private state and federal data clearinghouses the Catawba District has built relationships with over the last several decades.


DATA SOURCES
A sampling of the data sets include:
- U.S. Economic Development Administration
- U.S. Census Bureau
- U.S. Bureau of Labor and Statistics
- WISERTrade (import / exports)
- Bureau of Economic Analysis
- Bureau of Transportation Statistics
- STATS America
- ESRI Business Analyst
- Center for Economic Studies
- Harvard Business School
- County Business Patterns
- Integrated Postsecondary Education Data System
- O*Net (job skills)
- Informentum
It should be noted that while 2020 Census population numbers had been released at the time of publishing, 2019 data has been sourced in order to remain consistent with US Cluster Mapping data used throughout this document.
ANALYSIS STRATEGY
Catawba Regional’s intimate knowledge of the region’s historical, existing and emerging economic development trends in conjunction with the District’s diverse areas of expertise provide a unique platform for analysis of the regional socio-economic factors presented.
Industrial Inventory and Cluster Analysis
At the various geographies of analysis presented in the Economic Development Strategy, industries are clustered by NAICS codes. It is important to understand that NAICS codes are self reported by individual industries to the U.S. Census Bureau. At times this may mean that the code by which an industry identifies itself may not be intuitively associated with the employment center.
Additionally, clusters are broken out by two major reporting categories, traded and local:
- Local Clusters – these are clusters of industries which typically provide goods and services that are created and either consumed or delivered within the region of analysis
- Traded Clusters – these are clusters of industries which typically export goods and services created within the region to be consumed or delivered outside the region
Please note that while we will look at both Local Clusters and Traded Clusters in The Catawba Region section of the strategy, for the purposes of presenting and analyzing the two commuter sheds we will only focus upon Traded Clusters. This is due to the fact that Traded Cluster industries tend to be larger in scale and typically provide broader income opportunity to which workers are willing to commute.
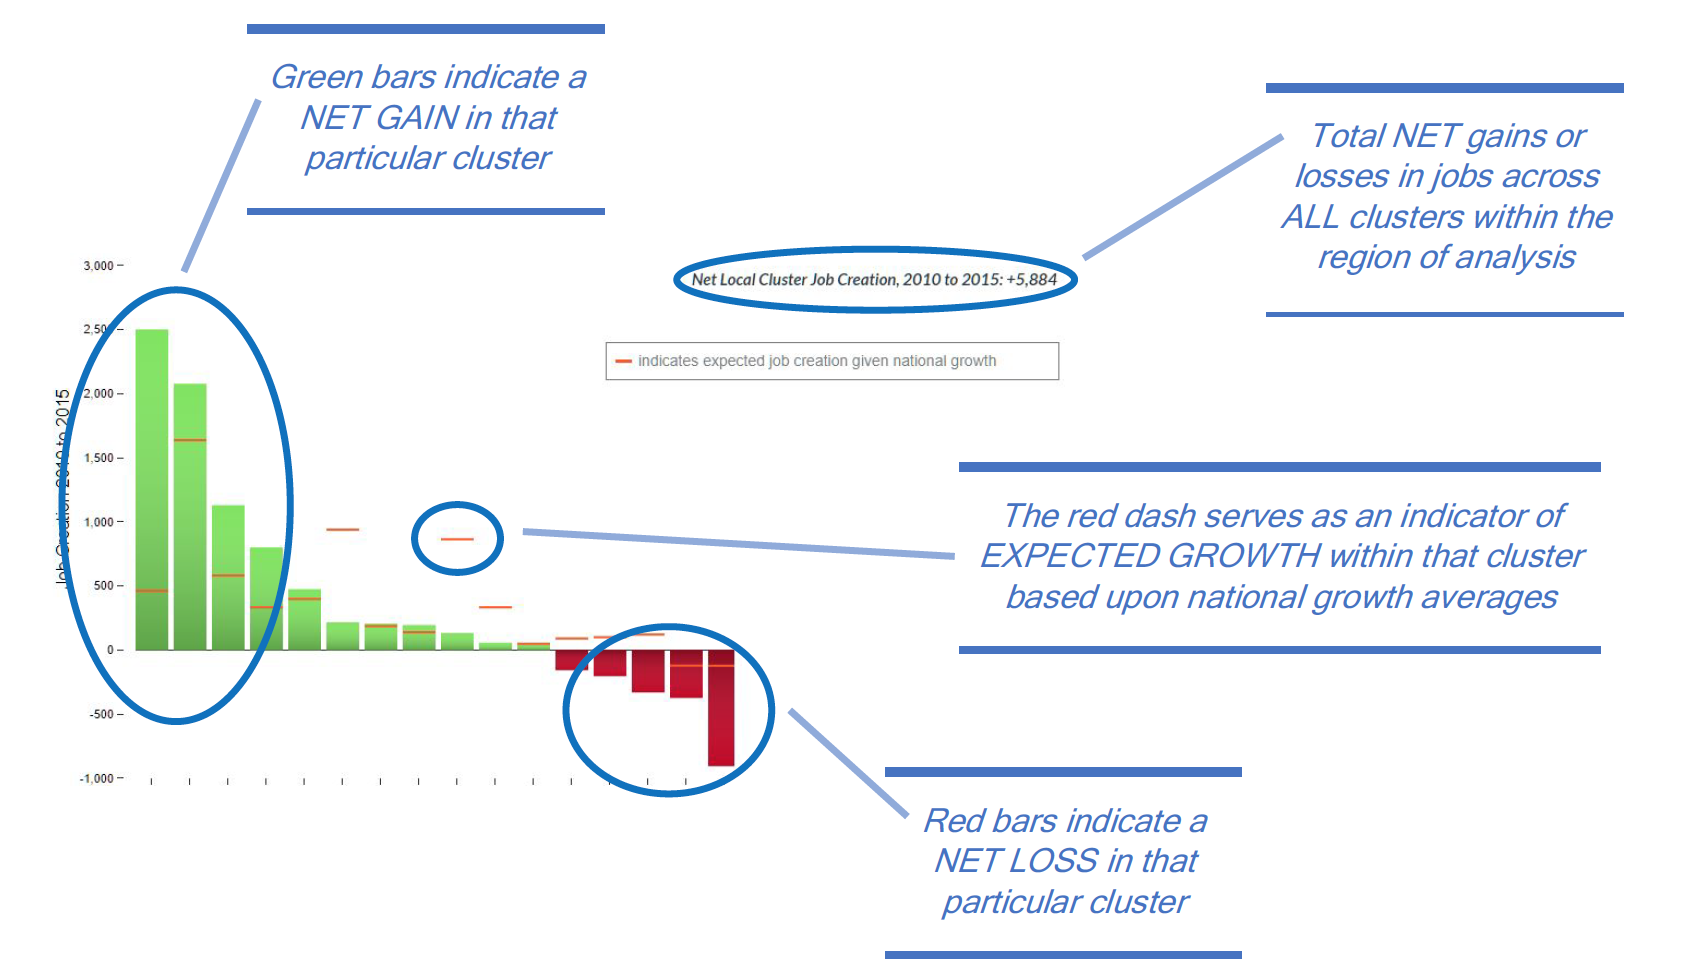
How to interpret Industry Cluster Charts


